At MProfit, we’re excited to announce a major product update, designed to make your portfolio tracking more insightful than ever!
We have just launched new Analytics Dashboards that come with a whole new interface and exciting new features 🙂
Let’s explore what’s new in MProfit:
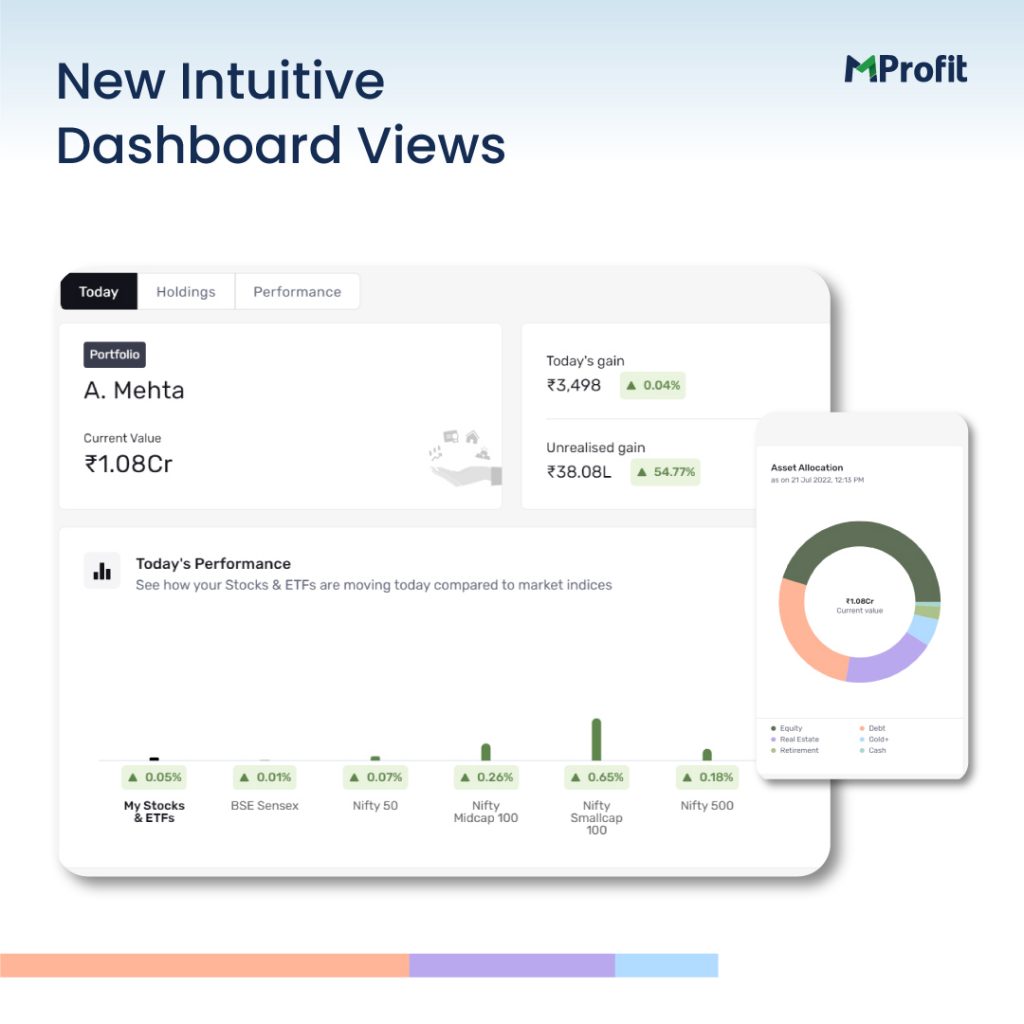
1. An Intuitive Visual Experience
Explore a new, engaging interface with vibrant charts and insights that are organised across three new intuitive dashboard views: Today, Holdings and Performance.
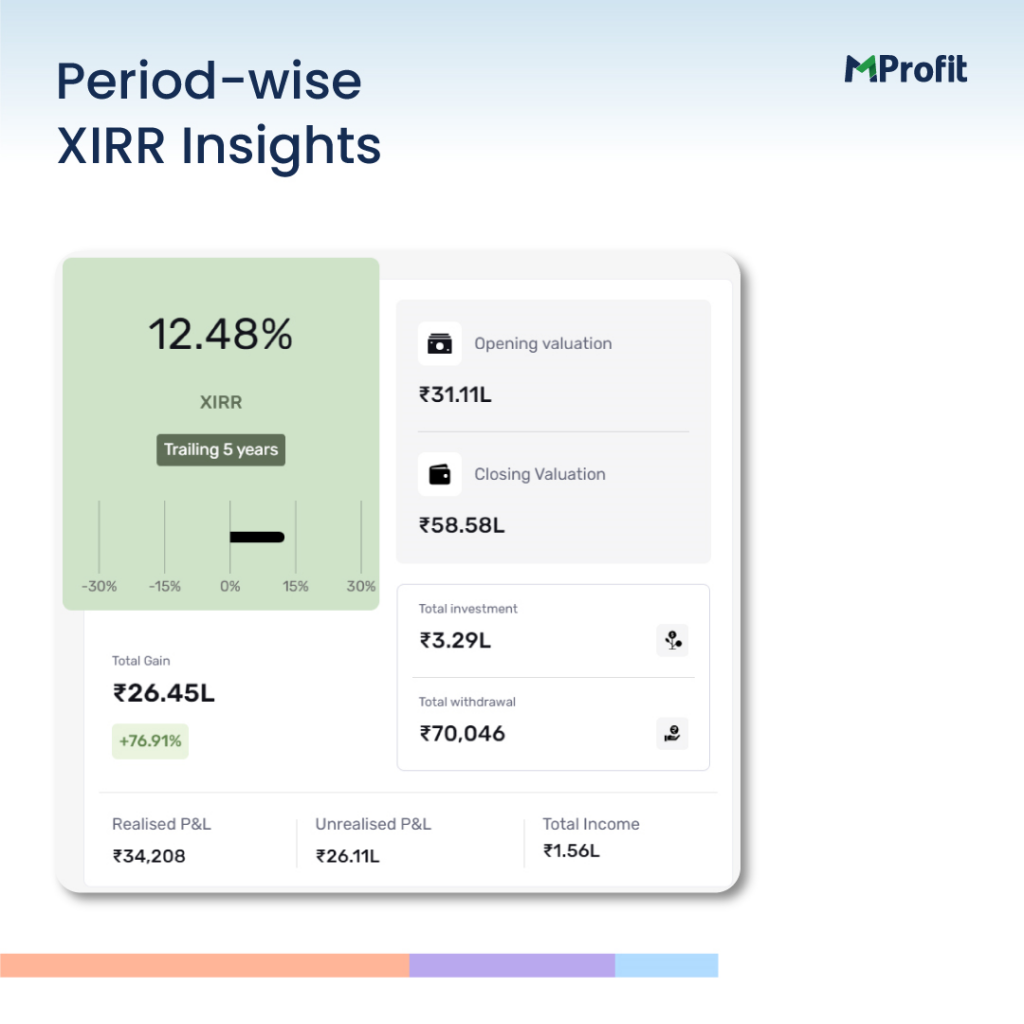
2. Period-wise XIRR
One of our most awaited features has been added to the MProfit platform.
Now, you can get XIRR (annualised return) insights for different periods of time.
This enables you to better understand your portfolio performance in different market cycles.
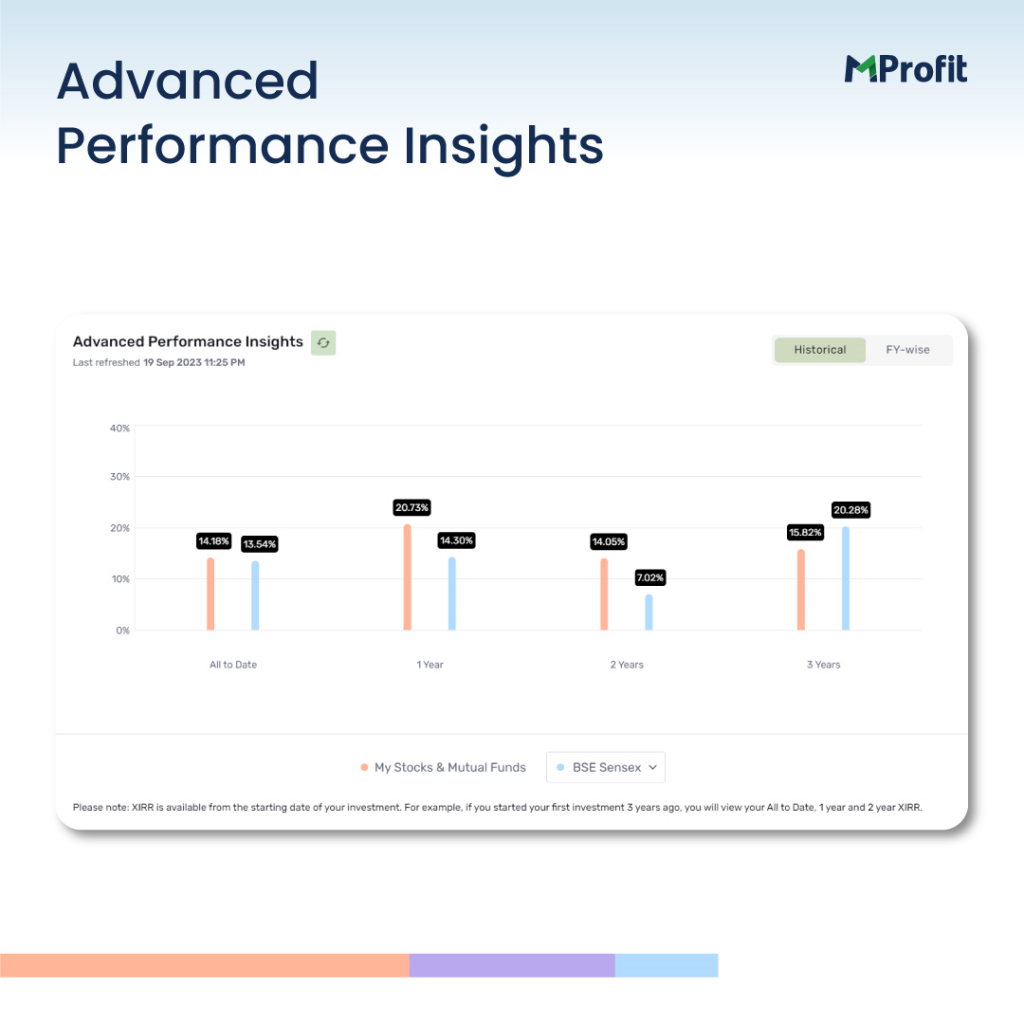
3. Advanced Performance Insights
In the Analytics Dashboards, you can now also view advanced performance insights:
– Historical XIRR (1 year / 2 year / 3 year / 5 year)
– Financial Year-wise XIRR
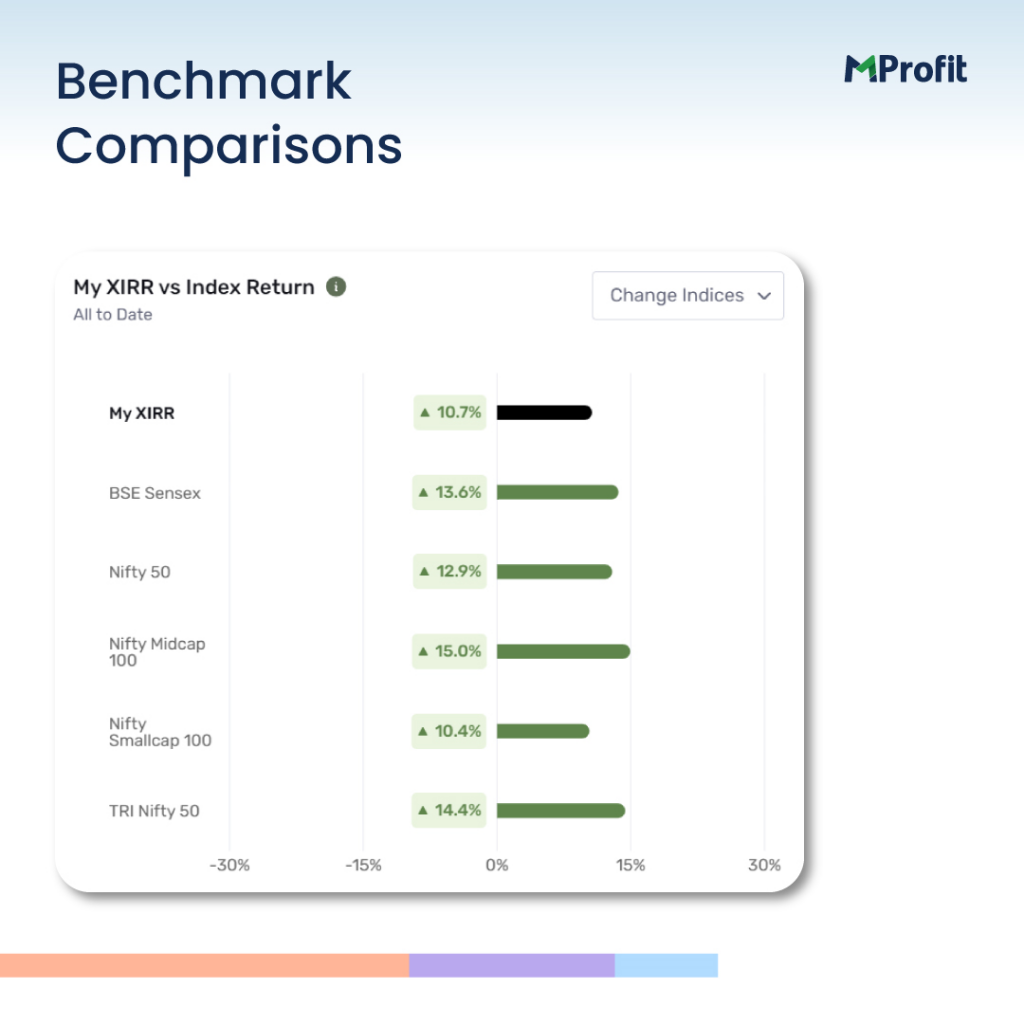
4. Benchmark Comparisons
Another much awaited feature in MProfit!
Now you can track your comparative performance against industry benchmarks!
Compare your returns for any asset, asset class or portfolio against a wide list of different market indices!
Track how your returns are faring during different time periods against indices such as Sensex, Nifty, TRI Nifty 50, smallcap & midcap indices and many more!
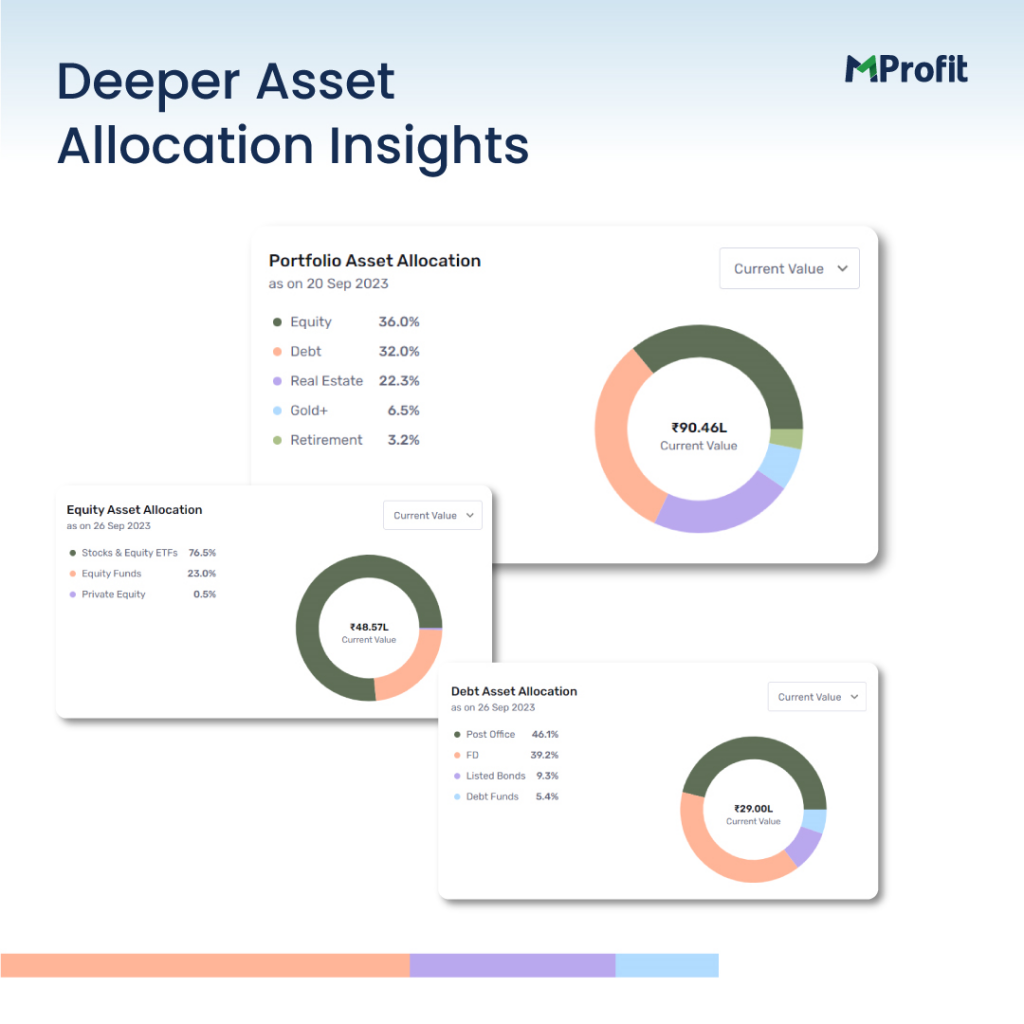
5. Deeper Asset Allocation Insights
MProfit now provides deeper asset allocation views across broader categories such as Equity, Debt, Gold and Retirement Products.
This enables you to holistically view your “true asset allocation” and ensure that your exposure to different asset categories is optimised.
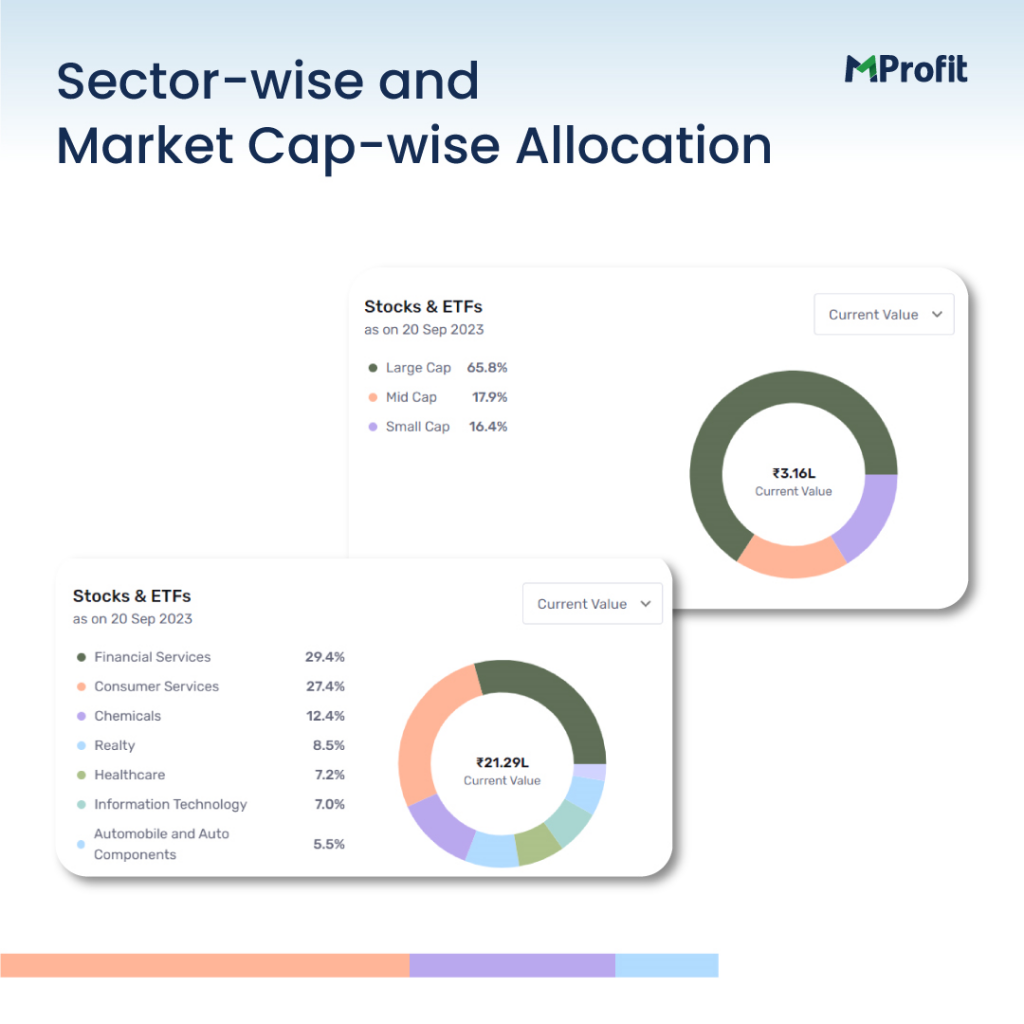
6. Sector-wise and Market Cap-wise Allocation
You can now see sector-wise and market-cap-wise views of your stock portfolio.
This will help you better understand trends in your stock portfolio and, in turn, make more informed investment decisions.
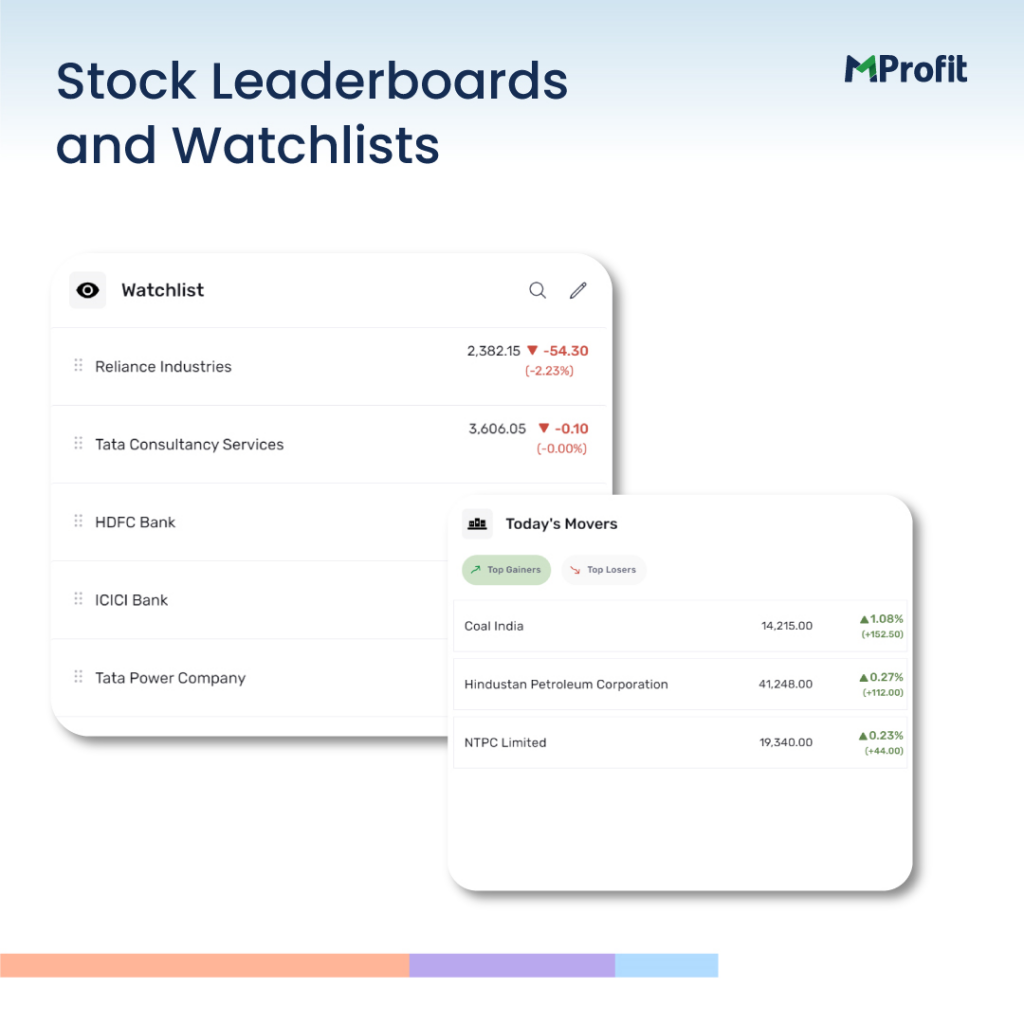
7. Stock Leaderboards and Watchlists
Stay updated on your stock portfolio’s daily movers with the new Today’s Movers feature.
The new Watchlist feature helps you to monitor stocks that you are interested in tracking on a daily basis.
How to Access the New MProfit Features?
To access the new Analytics Dashboards, simply login to your MProfit account and click Analytics in the top navigation.
If you need help getting started, you can book an MProfit online demo, and our team will be happy to connect with you!
Please note: The new features are in beta.
If you are new to MProfit, you can sign up for an MProfit account & get started right away.
Sign up & try the new features!
Comments